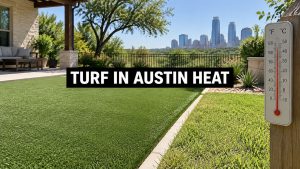

In a University of Nevada, Las Vegas and Desert Research Institute study, the maximum synthetic turf surface temperature reached 169°F, which was approximately 69°F hotter than irrigated natural grass and 62°F hotter than the surrounding air, according to the University of Nevada, Las Vegas study release. That's the number most sales pitches skip, and it's the right place to start any honest talk about the disadvantages of artificial turf in Austin. Turf can still be the right choice for some yards. It isn't a good choice when an installer pretends heat, runoff, repairs, and disposal don't exist.
How Hot Artificial Turf Gets by Midday
Published measurements show why midday surface heat deserves a place in any turf decision. The readings vary by product, month, and weather, so one number cannot predict every yard. They do establish a clear pattern: direct sun can make synthetic turf much hotter than the air or nearby grass.
Published daytime heat of synthetic turf
| Measurement | Synthetic turf | Comparison | What it means |
|---|---|---|---|
| Penn State, 10 products, by month | About 41–59°F above air at 3 feet | Air temperature 3 feet up | Gap changes with the month |
| New Jersey midday infrared, June 2025 | About 130°F (53°C) | Natural grass about 84°F (29°C) | Roughly 46°F hotter underfoot |
| Nighttime comparison in the same review | Generally cooler than natural grass | Living grass | Daytime sun is the real disadvantage |
| UNLV and Desert Research Institute, Aug 2006–Mar 2007 | Maximum 169°F | About 69°F hotter than irrigated natural grass | Peak extreme reading |
The 2025 review by the New Jersey Department of Environmental Protection summarized Penn State University measurements across 10 synthetic-turf products. Surface temperatures exceeded air temperature measured 3 feet above the ground by approximately 41–59°F (23–32°C), with the gap varying by month. In its June 2025 New Jersey case study, midday infrared readings put synthetic turf at about 130°F (53°C) and natural grass at 84°F (29°C).
The UNLV and Desert Research Institute study recorded a maximum synthetic turf temperature of 169°F, about 69°F above irrigated natural grass, according to the University of Nevada, Las Vegas study release. That is a peak extreme reading, not a typical temperature for every lawn. Still, it shows why a design should be judged under its actual sun exposure, not by a product description.
Who Feels That Heat First
Weather stations measure air. Bare feet, dog paws, toddlers' hands and knees, and anyone who sits or falls encounter the surface itself. A child tying a shoe, a dog resting in a sunny corner, or a guest stepping off a patio barefoot can meet concentrated contact heat.
Sunny summer afternoons are the predictable trouble window. Synthetic fibers and infill absorb and retain solar energy. In Austin, use an unshaded south or west yard from late morning through late afternoon during the hottest months as the test case. A design that works only in mild morning sun is not ready for the conditions that matter.
Practical rule: Ask how the yard behaves at 2 p.m. in August, not how it photographs in spring.
The New Jersey review also reports that synthetic turf is generally cooler than natural grass at night. That makes this a daytime surface-heating drawback, rather than round-the-clock warmth.
Do not accept “stays as cool as grass” as a complete answer. Ask the installer to account for shade placement, infill choice, and peak-hour use in the plan for your specific exposure. Shade and material choices can reduce the problem, but they cannot make a sun-exposed surface behave like natural grass at midday. Decide whether the remaining heat is acceptable before installation, because design choices cannot remove the drawback entirely.
A Hot Surface Is Not the Same as Heat Illness
A surface can burn skin without raising the air around it by the same amount. Conflating those two things leads homeowners to either panic about every installation or dismiss a real contact problem.
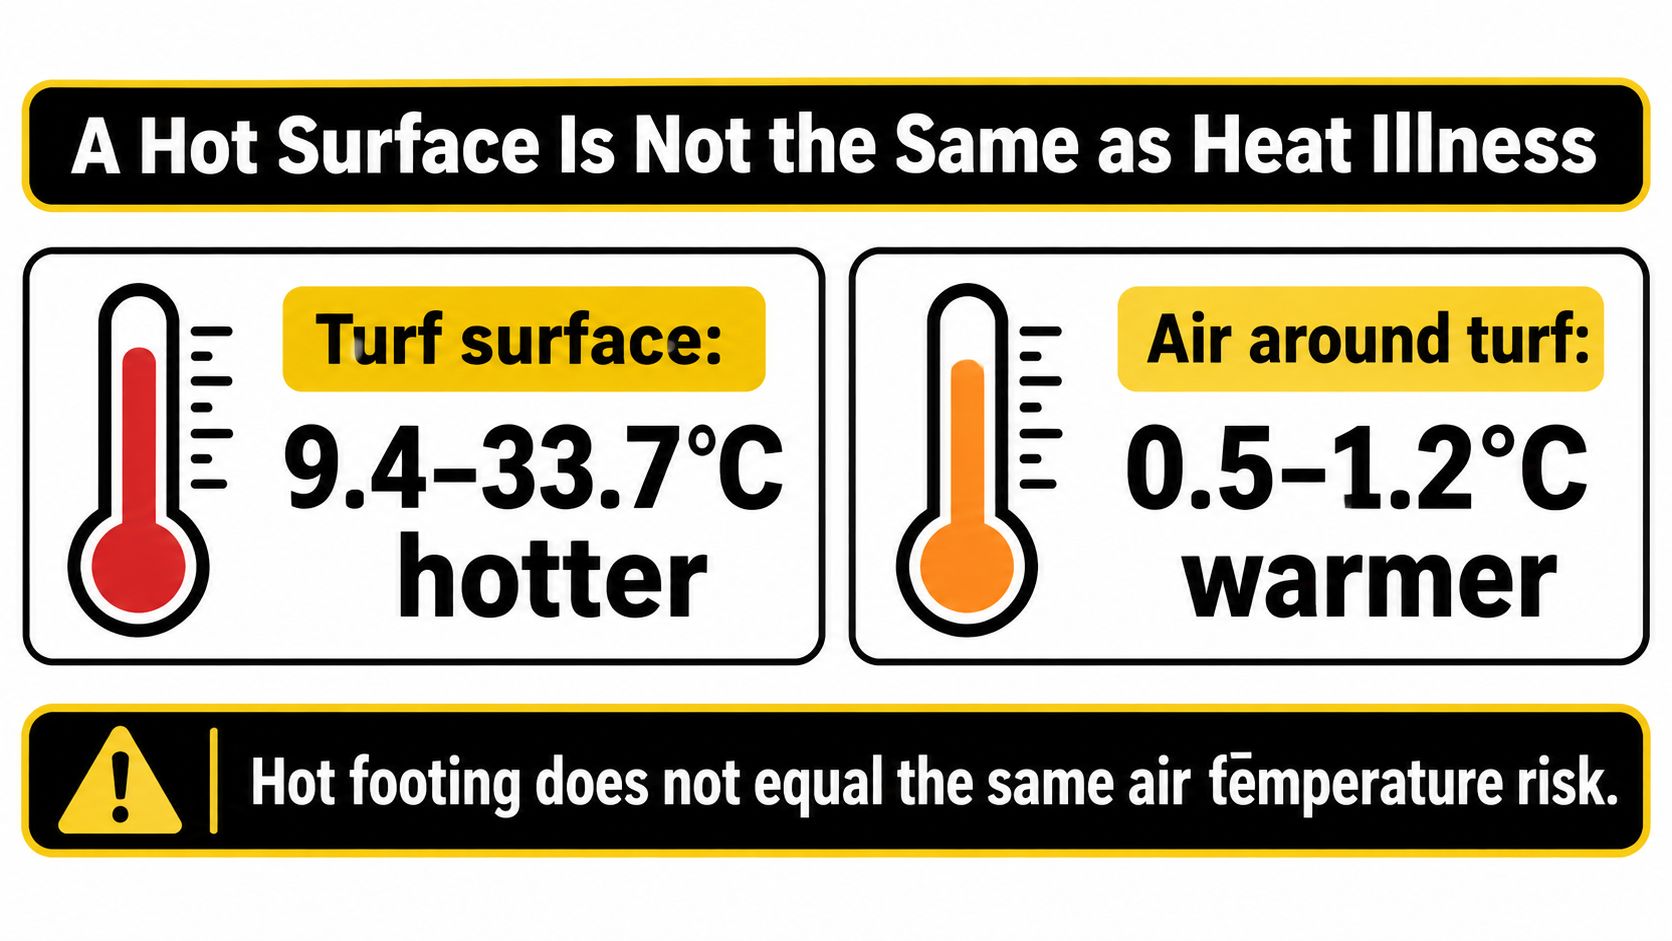
A 2025 systematic review of 23 publications found artificial turf surfaces were 9.4–33.7°C hotter than natural turf, while surrounding air was only 0.5–1.2°C warmer, according to the 2025 National Collaborating Centre for Environmental Health review. A university microclimate comparison in that review found surface temperatures averaging 34.9°C on artificial turf versus 24.0°C on grass, yet wet bulb globe temperature was nearly identical at 27.02°C versus 26.94°C.
The Stovetop Test
Think of a pan on a stove. The pan can burn your hand while the kitchen air barely changes. Turf works in a similar split. The surface temperature drives burns and discomfort on contact, while wet bulb globe temperature, a broader heat stress indicator, reflects air, humidity, sun, and wind acting on the whole body.
That distinction changes the recommendation. For an Austin play yard or dog run, the proven disadvantage is contact comfort during peak sun. It's not proof that every turf yard automatically raises whole body heat illness for every person who walks across it in shoes.
Several site factors swing the result:
- Direct sun and dark infill: Both push surface heat up fastest.
- Low wind and humidity: Both slow cooling for people and pets.
- Activity intensity: Sprinting and wrestling create more contact and more body heat than walking.
- Time of day: Late morning through afternoon carries the highest surface risk.
Current reviews show higher temperatures but not enough evidence to call every health outcome worse. Say that plainly. Don't let a seller use that uncertainty to wave away burns, and don't let a critic turn a hot surface reading into a guaranteed heat illness claim.
For families, the useful question is narrower. Who will touch this surface, with what skin or paws exposed, and at what hour? Answer that before you debate whole body heat stress in the abstract.
Shade Water and Infill Only Partly Cool Turf
Cooling measures help. None of them turns plastic fiber into a living lawn.
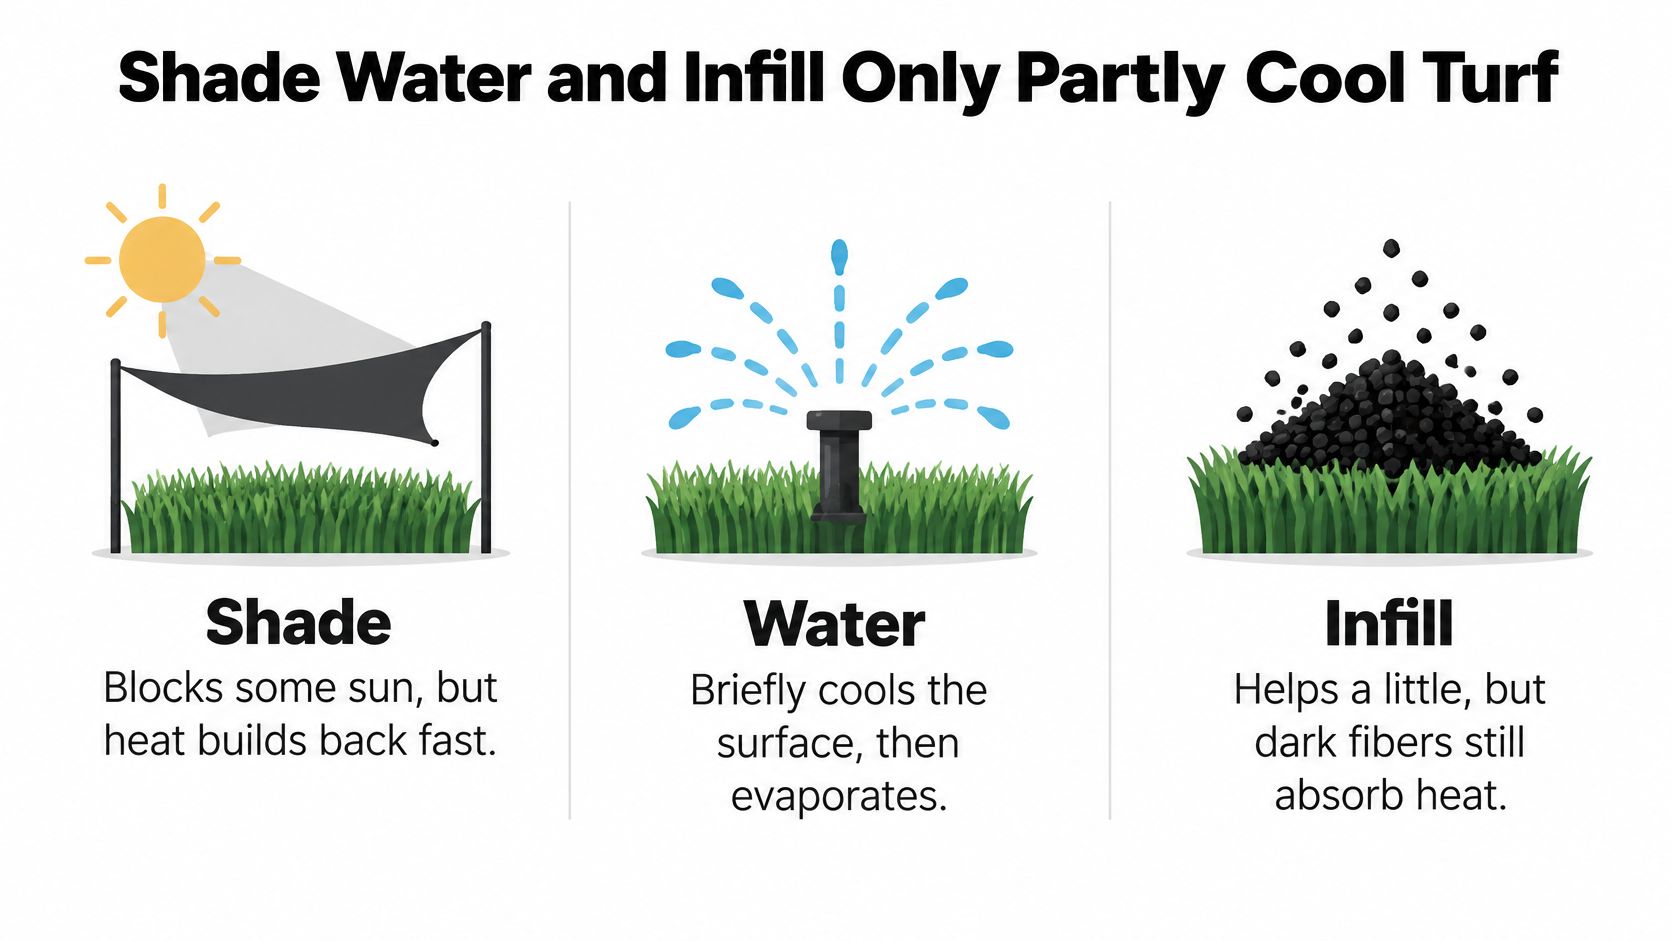
Dark polymer fibers and infill soak up sun, and turf has limited evaporative cooling compared with living grass, so heat builds at the surface where feet land. Water can knock that temperature down, but evidence summarized by the U.S. National Toxicology Program indicates surfaces returned to pre-irrigation temperatures within roughly 60–120 minutes, while some treatments reheated rapidly within 30 minutes, as reported in the New Jersey Department of Environmental Protection technical memorandum.
Put Mitigation in This Order
- Place play and pet zones in afternoon shade first. Use shade that already falls from trees, fences, or the house, or add a structure before turf goes down. Shade prevents heat from building instead of trying to remove it later.
- Choose lighter, heat reducing infill. Don't default to the darkest rubber crumb for a residential yard in full sun. Ask what heat-resistant artificial turf options and infill pairings lower surface temperature, and get the product names in writing.
- Keep water close, but budget the benefit. A hose down buys comfort for a while, not an afternoon. Plan on rechecking the surface after that window closes.
- Keep barefoot play and hard exercise off peak hours. Move intense dog play and kids' games to morning or evening when the yard sits in full western sun.
- Check the surface before use. Press a palm flat for several seconds where a child or dog will stand. If you can't hold it there comfortably, they shouldn't be sent onto it.
Watering turf before a party is a timing tactic, not a cooling system.
Those steps lower burn and discomfort risk. They don't make synthetic turf thermally equal to nearby planting beds, shade trees, or irrigated grass.
A west facing dog run with no shade is where this disadvantage stays large no matter the brand name. In that layout, change the layout, add real shade, shrink the turf area, or choose a different surface. Don't buy a premium label and hope it overrides physics.
Where Rain Fibers and Infill End Up
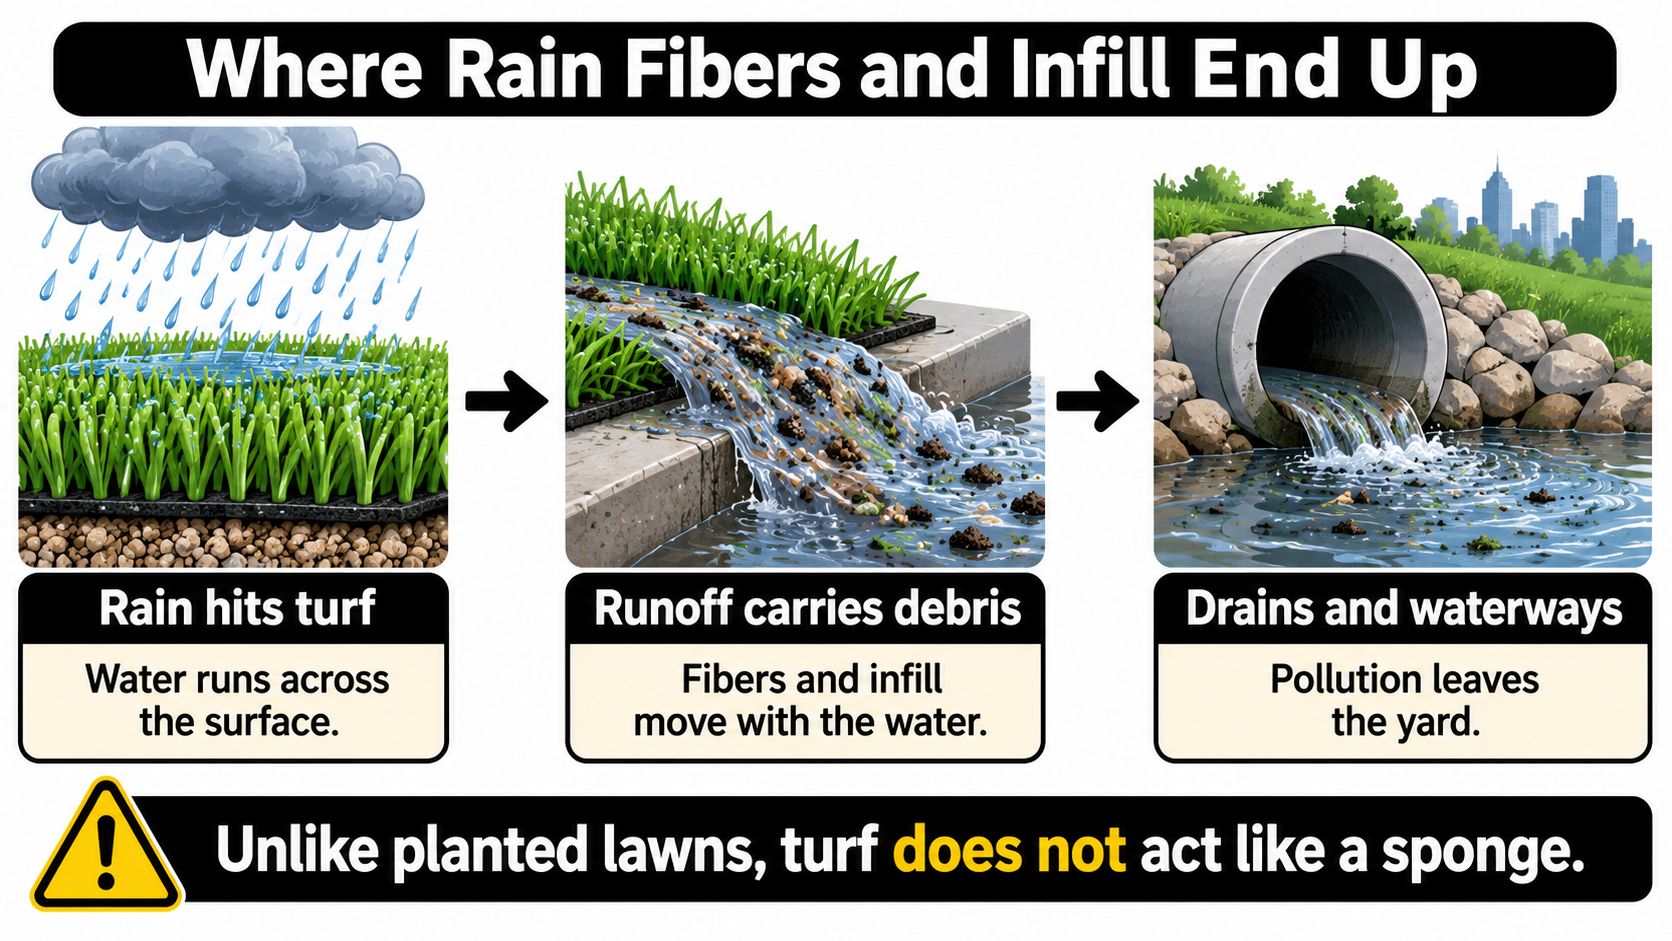
Follow one heavy rain across a turf yard. Water hits the fibers, moves through the backing and compacted base, follows the slope, and leaves at the lowest edge. Whatever it loosens along the way can leave with it.
A 2025 review prepared for the University of British Columbia reports artificial turf contributes to increased stormwater runoff and microplastic pollution, and one cited study measured more than 5,000 particles per liter in runoff, with plastic fibers the most abundant particles, followed by infill granules and fragments, according to the 2025 University of British Columbia review.
How Particles Leave the Yard
Repeated foot traffic, ultraviolet aging, brushing, rainfall, and surface drainage can dislodge fibers and infill. Runoff, drainage systems, and direct dispersion can then carry those particles into surrounding soil and water. A conventional compacted base also infiltrates less than vegetated soil, so the installation depends more heavily on correctly designed drainage.
That makes this a maintenance obligation, not only an environmental talking point. You'll need to replenish displaced infill, inspect transitions and drainage outlets, and prevent washout during heavy Texas rain. Calling that maintenance free is inaccurate.
A credible base plan for drainage for artificial grass specifies these items before excavation:
- Containment edges: Edging that holds infill inside the turf area at patios, beds, and gates.
- Slope and receiving soil: Where water slows down, soaks in, or keeps moving.
- Discharge points: The exact outlet, not a vague promise that water will drain.
- Filter or capture where feasible: Structures that catch fibers and granules before they reach a storm inlet.
Contrast two common Austin layouts. A flat, well drained pet run with contained edges and a planned outlet gives you places to inspect and clean. A sloped side yard that dumps onto a patio or toward a neighbor's fence moves the problem downhill and makes every downpour a cleanup.
That doesn't mean every installation pollutes at the same level. It means you shouldn't sign until someone answers one walkthrough question clearly. Where does a downpour leave this yard, and what stops fibers from leaving with it?
What the PFAS Evidence Shows
Is artificial turf a PFAS problem? The honest answer is that the evidence doesn't support a blanket yes or a blanket no.
Connecticut's Department of Public Health reports PFAS detected in Massachusetts artificial turf fields were within the range of background concentrations found in soils and surface waters, making it impossible to determine whether the turf itself was the source, according to Connecticut's Department of Public Health artificial turf guidance. The department also summarizes a peer reviewed 2022 study by researchers in Sweden and Canada, which found measured fluorinated substances appeared bound to turf components and did not leach into the environment, and those substances were not the type known to transform into harmful PFAS.
What to Ask Before You Sign
That picture is contested and limited, not a clean bill of health for every product. Peer reviewed research on this specific question remains limited, so product specific answers matter more than slogans.
Ask the installer for three things in writing:
- Product and backing identification: The exact turf, backing, and infill proposed for your yard.
- Supplier test reports: Written chemical test information for that product, not a generic brochure claim.
- Runoff handling: How water leaving the site will be captured or directed.
Don't accept "chemical free" without documents. Don't accept "all turf is hazardous" without them either.
PFAS questions also don't erase the other disadvantages of artificial turf. Heat, runoff design, repairs, and replacement still need answers even if a specific product's chemistry checks out.
Upfront Cost Repairs and the Landfill Bill
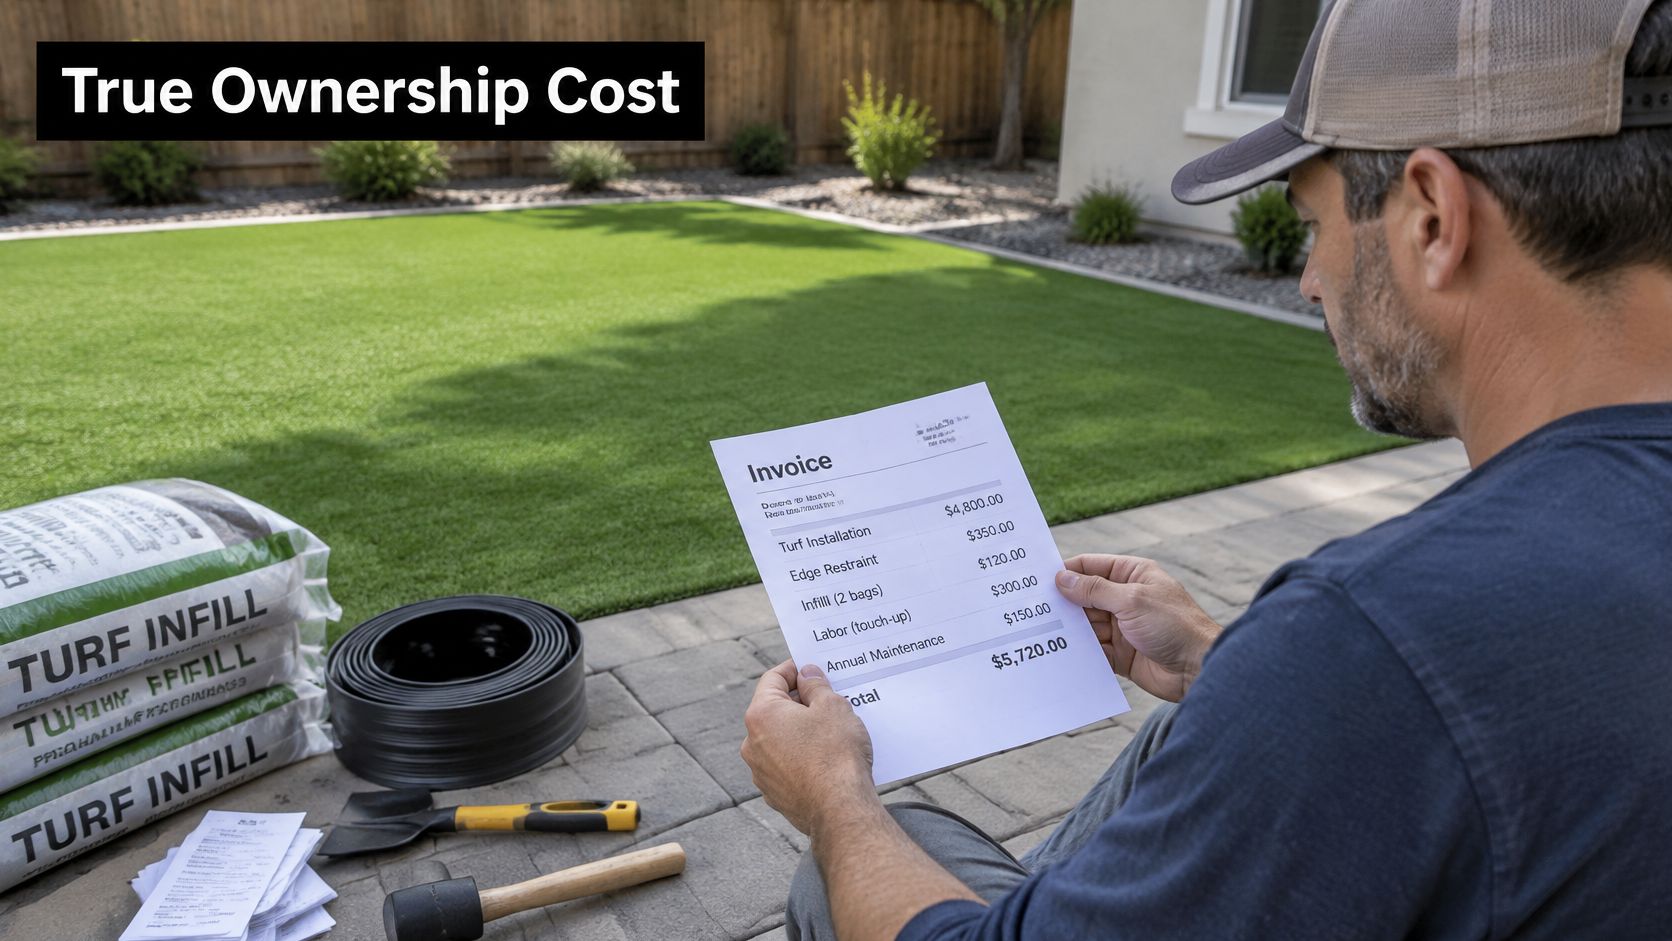
Price turf as ownership, not as a single install invoice. Upfront, you're paying for turf, infill, edging, base material, excavation, and labor that seed doesn't require. The offset is less mowing, fewer chemicals, and no routine irrigation, which is why the math can work for a high use commercial site and fail for a small shaded yard that was cheap to maintain anyway.
Run your own numbers against the cost of artificial turf for your square footage and access conditions. Then ask how many years of water and maintenance savings you need before replacement resets the math.
Repairs Have Limits
A lifted seam or small tear can often be patched, and displaced infill can be topped up and brushed back into place. A failed base, widespread ultraviolet breakdown, or damaged backing is different. That usually means replacing a section or the full installation, not a weekend fix with a glue gun.
Two shortcuts make damage worse. Don't pour boiling water on artificial grass, because extreme heat can soften, warp, or permanently damage fibers and backing. Don't spray harsh herbicides as a cleaning shortcut, and we don't recommend using RoundUp on artificial grass.
Ownership test: If the quote has no removal and disposal line for the next replacement, it's not a full ownership cost.
Disposal is the part most quotes leave vague. A separate environmental scoping review estimated a 9,000-square-meter artificial turf installation with a 10-year life produces about 55.6 metric tons of carbon dioxide equivalent, approximately three times the footprint estimated for natural turf of the same size, according to the environmental scoping review in the International Journal of Environmental Science and Technology. Synthetic turf fields and their infill usually end up in landfills, and life cycle analyses have found greater lifetime greenhouse gas emissions for artificial turf than natural turf when production, maintenance, and removal are considered.
Scale that down without inventing a backyard tonnage. Ask who hauls the old roll, whether any of it is recycled locally, and where the infill goes. If the answer is a shrug, you're looking at a future landfill bill that nobody priced.
Foot and Ankle Injuries on Playing Turf
The clearest injury concern in the research is foot and ankle risk, not a universal injury penalty for every artificial surface. Sports-field findings can help you ask better questions about traction and upkeep, but they do not predict the risk of walking across a backyard lawn or letting a dog out.
Injury findings on artificial turf versus grass
| Finding | Result | Limit |
|---|---|---|
| Overall injury difference | 51.6% of studies found no significant difference; 35.5% reported higher rates on turf; 12.9% reported higher rates on grass | Findings vary across studies and do not make every installation unsafe |
| Foot and ankle | 14 of 24 studies (58.3%) reported higher injury rates on artificial turf | Shoes, weather, activity, and upkeep still matter |
| Knee | Findings are mixed, with no clear, consistent turf penalty | Study results vary |
| Elite-sport injuries | Findings are mixed across elite-sport studies | Competitive play is not directly comparable to home use |
A 2022 systematic review of lower-extremity injury research found that 51.6% of included studies reported no significant overall injury difference between artificial turf and natural grass, while 35.5% reported higher overall rates on artificial turf and 12.9% reported higher rates on natural grass. The review also found that 14 of 24 studies, or 58.3%, reported higher foot and ankle injury rates on artificial turf, according to the 2022 systematic review in PMC. Those figures describe patterns across studies, not the odds of injury for one person on one lawn.
Scale the Risk to the Use
Elite athletes sprint, cut, and collide in cleats. Their injury findings are mixed and cannot be transferred directly to a home play area, pet run, or patio edge. Surface type, maintenance, footwear, sport, weather, and behavior all shape how a field performs. Treat the sports evidence as a reason to ask about surface traction and care, not as a backyard injury forecast.
For a home play area, focus on traction and maintenance. Artificial playground turf should be chosen and maintained for its intended use, with appropriate infill and fibers kept brushed rather than flattened. A well-maintained residential surface is not the same as a worn competitive field, but no turf design can erase every difference in how surfaces behave underfoot.
If people will sprint and change direction, ask about infill depth, grooming, shock absorption, and suitable footwear before installation. For ordinary walking, lounging, or letting a dog outside, sports-injury findings matter less than how the surface suits those activities. Match the product and maintenance plan to the movement the yard will see, and judge the remaining injury concern with that use in mind.
Schedule a Drawback-First Austin Site Visit
Artificial turf suits some Austin yards, especially where the owner wants year-round green, less watering, or a surface for heavy pet traffic. The tradeoffs remain: afternoon heat, disposal at replacement, and the need for a properly built base.
Skip turf for an unshaded play area used barefoot in the afternoon. It also will not meet needs for living soil or the lowest-carbon surface. Consider a smaller turf area, shade planting, or another surface instead.
What We Check on Site
Bring the site and describe how you use it, whether for pets, play, entertaining, or commercial foot traffic. A useful visit should address:
- Afternoon shade map: Where shade falls and whether play or pet areas can be placed out of direct sun.
- Product fit for exposure: Which heat-resistant, UV-stabilized turf and cool-touch residential options suit the site. Residential turf comes in multiple blade colors and thicknesses, with a natural-looking thatch layer and cool-touch technology that prevents summer scorching. These options do not remove the heat drawback of an unshaded western exposure.
- Base, drainage, and infill build: How the base will be prepared and sloped to manage Texas downpours, and how infill will be distributed and kept even. Commercial and pet areas need professional installation, with proper base preparation, drainage, and infill distribution.
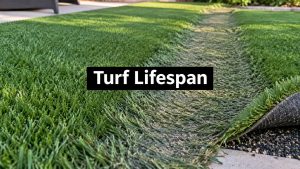
- Lifespan assumptions: With proper installation, artificial turf lasts 15–20+ years, even in Austin's heat and fluctuating climate. Ask what that estimate assumes about grooming, infill top-ups, and the intended use.
A sound recommendation names the drawbacks first, then explains which design choices can reduce them. Shade, drainage, and careful installation can address some concerns; they cannot prevent the need to replace the turf eventually.
Book a visit with these questions in hand. Ask for a factors-based plan covering shade, drainage, product choice, and replacement. You should leave knowing where turf fits, where it does not, and which tradeoffs remain.
Contact Modern Yard Landscapes to schedule a drawback-first Austin site visit. Discuss afternoon shade, drainage, and how you plan to use the space before choosing a product.